Lecture 1: Welcome to CSCI 1360E!
CSCI 1360E: Foundations for Informatics and Analytics
Overview and Objectives
In this lecture, we'll go over the basic principles of the field of data science and analytics. By the end of the lecture, you should be able to
- Broadly define "data science" and understand its role as an interdisciplinary field of study
- Identify the six major skill divisions of a data scientist
- Provide some justification for why there is a sudden interest and national need for trained data scientists
No programming just yet; this is mainly a history and background lesson.
Part 1: Data Science
At some point in the last few years, you've most likely stumbled across at least one of the many memes surrounding "big data" and "data science."
The level of ubiquity with which these terms have thoroughly saturated the tech sector's vernacular has rendered these terms almost meaningless. Indeed, many have argued that data science may very well not be anything new, but rather a rehashing and rebranding of ideas that did not gain traction previously, for whatever reason.
Before differentiating data science as a field unto itself and justifying its existence, I'll first offer a working definition. In my opinion, the most cogent and concise definition of data science is encapsulated in the following Venn diagram:
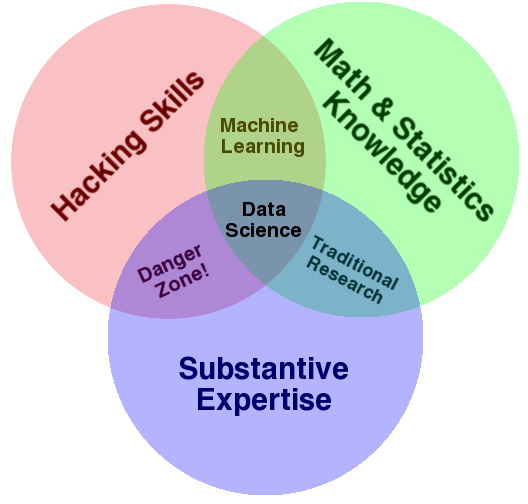
Data Science as a proper field of study is the confluence of three major aspects:
1: Hacking skills: the ability to code, and knowledge of available tools.
2: Math and statistics: strong quantitative skills that can be implemented in code.
3: Substantive expertise: some specialized area of emphasis.
The third point is crucial to the overall definition of data science, and is also the reason that defining data science as a distinct field is so controversial. After all, isn't a data scientist whose substantive experience is biology just a quantitative biologist with strong programming skills?
I'll instantiate the answer to this question with a somewhat snarky data science definition I've stumbled across before:
Data Scientist (n.): Person who is better at statistics than any software engineer, and better at software engineering than any statistician.
Part 2: How is data science different?
The best answer here is "it depends." This being a college course, however, we'll need to be more rigorous than that if we expect to get any credit.
A big part of the ascendence of data science is, essentially, Moore's Law.
Where once upon a time, digital storage was a luxury and available processing power required hours to perform the most basic computations, we're now right smack in the middle of an exponential expansion of digitized data creation and enough processing power to crunch a significant portion of it.
How many of you know the word "yottabyte"? It's likely that, in your lifetimes, we'll start using this term regularly.
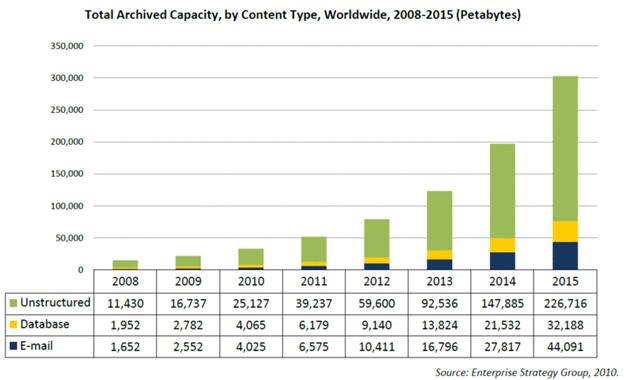
In effect, data science is not "new", but rather the result of technologies that have made such theoretical advancements plausible in practice.
- Digital storage is cheap enough to store everything.
- Modern CPUs and graphics cards can perform trillions of calculations per second.
- We can put sensors on everything and store the ALL the information--we'll figure out later what information is actually useful.
There is, nevertheless, a lot of overlap between this new field of "data science" and those that many regard as the progenitors: statistics and machine learning.
Many data scientists are from academia, with Ph.D.s! (e.g. machine learning, statistics)
Many other data scientists have stronger software engineering backgrounds.
To quote Joel Grus in his book, Data Science from Scratch:
In short, pretty much no matter how you define data science, you'll find practitioners for whom the definition is totally, absolutely wrong.
So we fall back to: "a professional who uses scientific methods to liberate and create meaning from raw data"
Unfortunately, this is too overly broad to be useful; applied statisticians would claim this definition is, almost word-for-word, what they've been doing for centuries.
Is there any hope?!
(spoiler alert: yes)
While the popular media tropes of "big data," "skills," and "jobs" don't inherently justify the spawn of a new field, there is nonetheless still a solid case to be made for a data science entity.
Part 3: "Greater" Data Science
It's important to note first: data science did not develop overnight.
Despite the seemingly rapid rise of Data Science as a field, "big data" as a meme, and the data scientist as an industry gold standard, this was something envisioned over 50 years ago by John Turkey in his book, The Future of Data Analytics (1962!)
Presented broad concepts of
- Data analytics
- Intepretation of said analytics
- Visualization
as their own field, not just branches or extensions of math and stats.
There is legitimate value in training people in the practice of extracting information from data.
from "getting acquainted" with the data
to delivering major conclusions based on it
This is the field of "Greater Data Science", or GDS.
1: Data Exploration and Preparation
Ever heard this?
"A data scientist spends 80% of their time cleaning and rearranging their data."
It's a little rhetorical (what about cat videos?)
But data are messy, often missing certain values or corrupted in other ways that would break naive attempts at analysis.
Furthermore, there's something to be said for exploring data beforehand; "getting a feel for it."
Before you write a term paper, you'd probably take some time to assemble and read primary sources that address the topic you're planning to write about. This way, you have some background information at your disposal, some context, before you even start writing.
That's what data exploration is: turning over the data (or the topic matter) before actually doing any analysis.
2: Data Representation and Transformation
There are countless data formats, with more appearing all the time:
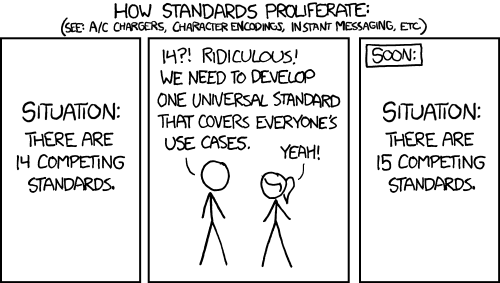
But how we represent data is crucial to our analysis.
You're probably familiar with Excel spreadsheets; these are insanely useful for putting data in an organized format that can be easily analyzed--by row, by column, or even with some more sophisticated macros (basically code).
Perhaps you've hand-recorded the stats of a baseball team you're interested in, or written down the expression levels of some protein you're working on. This is your data, but in its handwritten form, you can't really do much analysis. You need to represent it differently, transforming it from its current form into one more amenable to analysis.
3: Computing with Data
Computing tools change; computer science fundamentals don't.
...nevertheless, you'll need to be well-versed in a broad range of tools for reading, analyzing, and interpreting data at each stage of the data science pipeline.
- What programming language will you use?
- What data representations will you use within that language to maximize the efficiency of the analysis?
- What kind of platforms will you deploy your programs on?
4: Data Visualization and Presentation
"If you can't write about it, you can't prove you know or understand it."
Not a lot of opportunity for written answers in this course...
...but the art of visualization is a close proxy!
Visualization is rguably one of the most important aspects of data science, as it is one of (if not the) primary ways in which analysis results are conveyed.
I love giving examples of bad visualizations. Like bad writing, it actively makes the situation even more confusing than it was.
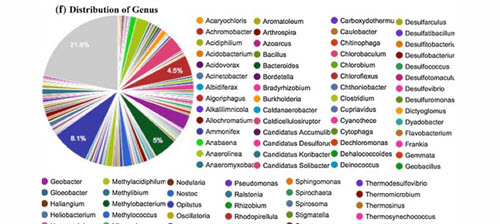
I don't know about you, but I can't tell what's happening here. I could barely even tell you what the figure is trying to say.
Good visualizations, like good writing, take practice to get right.
5: Data Modeling
Broadly speaking, there are two modeling cultures:
- Generative modeling. In this case, you start with some dataset $\mathcal{X}$ and, using your knowledge of the data, construct a model $\mathcal{M}$ that could have feasibly generated your dataset $\mathcal{X}$.
- Predictive modeling. In this case, you start with some dataset $\mathcal{X}$ and attempt to directly map it to some prediction (for example, identifying faces in images).
The first one is beyond the scope of the course, but we'll touch on the second one toward the end. The takeaway here: there are a lot of different modeling approaches you could use for any given problem, so familiarity with these approaches is key to understanding what the best approach for a given problem is.
6: Science about Data Science
Always need a healthy dose of meta! GDS should be able to evaluate itself.
- Packaging commonly-used analysis techniques or workflows into easy-to-use software (like Python!)
- Analyzing an algorithm's runtime and memory efficiency
- Measuring the effectiveness of human workflows from data extraction and exploration to final predictions
- Verifying existing results!
Part 4: The Perfect [Data] Storm
Oh, and: there is a lot of money in data science. A lot.
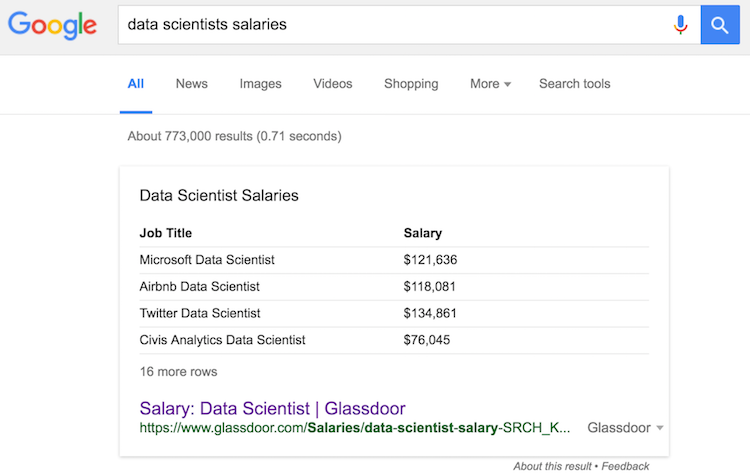
As our society relies ever more heavily on digitized data collection and automated decision making, those with the right skill sets to help shape these new infrastructures will continue to be in demand for awhile.
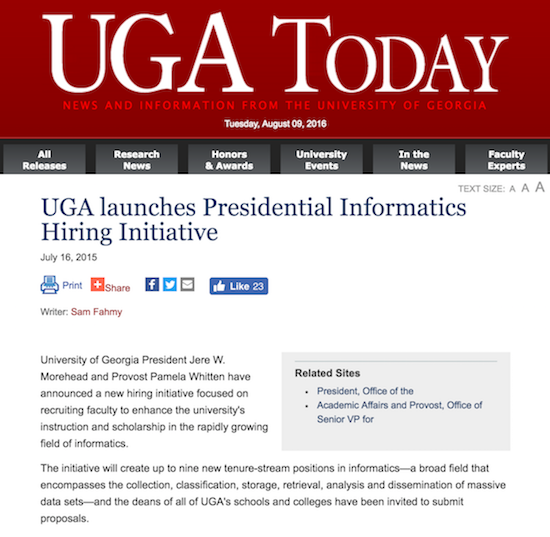
Everybody's building a data science program these days
...and UGA is no exception!
Not just tech companies! Any company that deals with any kind of data will likely have a need for highly trained data scientists.
We live in an era where
- cheap digital storage
- powerful computing hardware
- unprecedented digital connectivity
have combined to create a perfect storm for those with the skills to ingest, structure, and analyze all the data that is being generated.
By the end of this course, my goal is for you to have those skills!
Review Questions
Some things to consider. Work on these with a classmate, or even in the Slack channel.
1: Why is the combination of hacking skills and substantive expertise, devoid of math and statistics knowledge, considered the "danger zone"?
2: Of the six divisions of "GDS," which one do you think is most prevalent in mainstream media? Why?
3: What's wrong with saying that data science is just statistics, but with computers?
4: Think of a company you wouldn't normally consider a "tech company," and contemplate how they might use a data science division to improve their bottom line.
Course Administrivia
Website: https://eds-uga.github.io/csci1360e-su18 (course schedule and syllabus are here)
Lectures: Mondays, Wednesdays, and Fridays (except this week and in the case of holidays)
Programming Assignments: 10 of them (not including "Assignment 0"), all to be done on JupyterHub. Released every Tuesday & Thursday.
Exams: 2 of them (midterm and final)
Slack: Dedicated Slack team, https://eds-uga-csci1360.slack.com, to ask and answer questions.
JupyterHub
This is the web portal through which all the programming assignments AND exams will be done. Part of Assignment 0 will be familiarizing yourself with how it works!
- Your username is your UGA MyID
- Your password is also your UGA MyID
- JupyterHub is NOT connected to CAS, so don't use your MyID password
To repeat: your initial JupyterHub password is NOT your current UGA password, but rather, simply, your MyID username. Assignment 0 will take you through how to change your password to whatever you want.
Grading
- Assignments: 60% (10 of them)
- Participation: 5% (asking and answering questions in Slack)
- Midterm Exam: 15% (Tuesday, June 28)
- Final Exam: 20% (Monday, July 30)
The exams will take place on JupyterHub. More details to follow on those, but briefly: you'll be given a 24-hour period on those dates within which you can start the exams anytime.
Ample opportunities for extra credit on assignments and exams.
Don't ask about doing "extra" extra credit. Just don't. kthx bai
Please don't copy code.
Slack
This is where all course communication will take place.
- Lecture announcements
- Homework announcements
- Answering questions
- Posting cool links
- etc.
You're still welcome to send me emails (put "CSCI 1360E" in the subject), but I'll probably just answer the questions in Slack anyway.
Appendix: Additional Resources
- Grus, Joel. Data Science from Scratch: First Principles with Python. 2015.
- Donoho, David. 50 Years of Data Science. 2010.
